

This is the second part of an article that describes how banks have accommodated the very large involuntary increase in their Fed reserve balances that corresponds to Fed asset purchases. In this post, I show that banks increased their deposit funding substantially, allowing them to reduce nondeposit borrowings. “Core” deposits—deposits excluding large time deposits—also increased significantly, offset, in part, by a decline in large time deposits, which are deposits above $100,000. Concurrently, equity financing declined as a share of assets. I conclude that Fed asset purchases are not responsible directly for the surge in deposits and reduction in other liabilities and equities. Rather, both Fed and bank portfolio shifts are responses to heightened economic stress and uncertainty.
Fed Asset Purchases, and Bank Assets and Liabilities
In response to the COVID-19 shock in early 2020, the Federal Reserve aggressively purchased bonds, which increased Federal Reserve balances by $4.62 trillion in the two years through the end of 2021. Meanwhile, commercial banks’ total assets increased by $4.44 trillion and total liabilities increased by $4.36 trillion.1
My previous post showed that, in aggregate, banks’ loans-to-assets ratio declined sharply in 2020-21, while the share of their assets held as securities and cash assets increased. I described these shifts collectively as constituting a “de-risking” of bank balance sheets. Banks’ asset-liquidity positions also improved, while future profitability may be adversely affected.
Banks’ Core Deposits-to-Assets Ratio Increased Sharply
Here I show an analogous de-risking of the liability side of banks’ balance sheets, which resulted in improved funding liquidity, during the two years ending Dec. 29, 2021.2 Banks’ core deposits increased by $4.97 trillion, even more than the increase in assets or liabilities. As the figure below shows, the large two-year increase of core deposits raised the average ratio of core deposits to assets by 8.9 percentage points. Because core deposits reduce a bank’s funding-liquidity risk and are low-cost, an increase in their share of balance-sheet funding reduces overall liquidity risk and improves profitability. Core deposits defined this way have not provided a larger share of balance-sheet funding since at least 1973, when the Federal Reserve’s H.8 statistical release began.
Changes in the Ratios of Commercial Banks’ Liabilities and Equity: December 2019 to December 2021
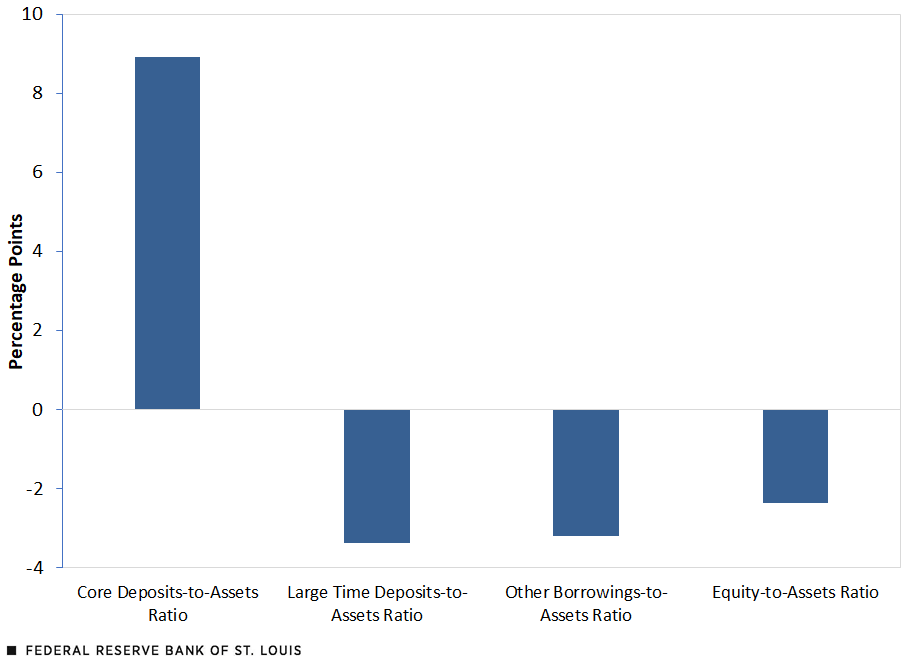
SOURCES: Federal Reserve Board H.8 Release: Assets and Liabilities of Commercial Banks in the United States, and author’s calculations.
NOTES: The figure shows the two-year change ending in December 2021 in the ratio of banks’ liabilities and equity relative to assets. The four categories are core deposits, large time deposits, other borrowings and equity (the residual of assets minus liabilities). Core deposits are total deposits less large time deposits. Other borrowings are total liabilities less total deposits. The only category that increased was the core deposits-to-assets ratio.
Bank Liabilities Evolved Similarly during the Previous Episode of Fed Asset Purchases
As I noted in my first post, the Fed’s bond buying after the financial crisis led to a large boost in the Fed’s holdings of securities. The overall size of the Fed’s balance sheet changed little because the holdings of other crisis-related assets declined. This contrasts with what happened in the current period.
As the figure below shows, however, core-deposit funding increased by a nearly identical 9 percentage points during the two years ending in December 2010. Equity funding also increased relative to assets, while large time deposits and nondeposit borrowings decreased significantly.
Change in Ratios of Liabilities and Equity: Great Recession and Aftermath
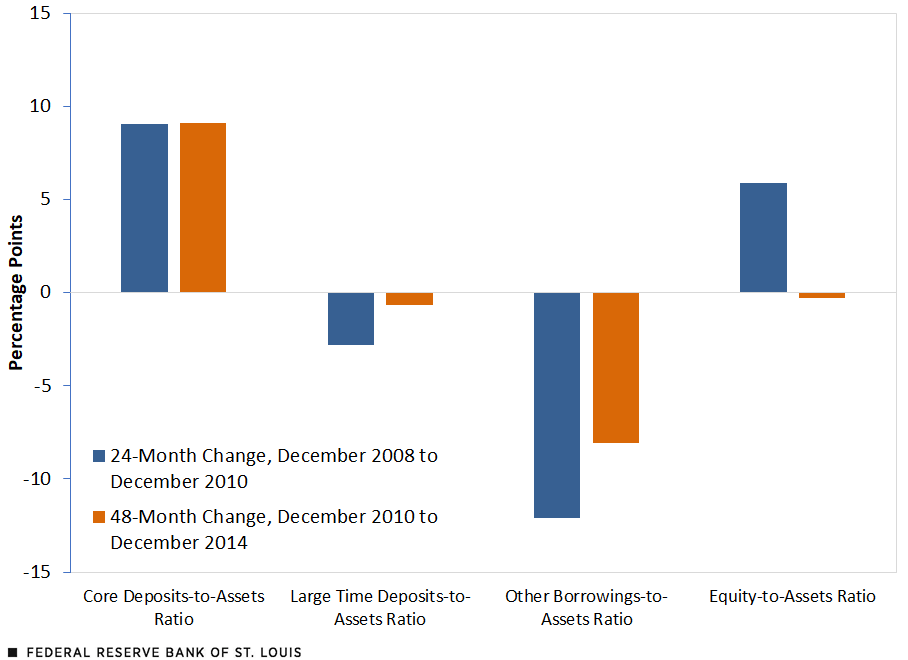
SOURCES: Federal Reserve Board H.8 Release: Assets and Liabilities of Commercial Banks in the United States, and author’s calculations.
NOTES: The figure shows the two-year change ending in December 2010 and the four-year change ending in December 2014, in the ratio of banks’ liabilities and equity relative to assets. The four categories are core deposits, large time deposits, other borrowings and equity (the residual of assets minus liabilities). Core deposits are total deposits less large time deposits. Other borrowings are total liabilities less total deposits. The core deposits-to-assets ratio increased by about 9 percentage points in both periods. With a single exception—the residual-to-assets ratio during 2008-10—all of the other categories decreased in both periods.
The Fed continued to purchase assets in large amounts after 2010, in what came to be known as “QE2” and “QE3.”3 In the four years ending Dec. 31, 2014, the Fed’s securities holdings and total factors supplying reserve funds increased an almost identical $2.1 trillion. As the figure above shows, banks’ core deposits increased an additional 9.1 percentage points relative to assets. Nondeposit borrowings decreased a further 8.1 percentage points, while large time deposits and equity financing changed little. These changes in the composition of liabilities and equity—away from costlier and less-liquid funding categories and toward core deposits—closely resemble the pattern seen in the COVID-19 period.
A Significant De-Risking of Bank Balance Sheets after the Financial Crisis
Combining the most important balance-sheet adjustments identified in this and my previous post—relative to assets, banks hold fewer loans and more deposits—the figure below illustrates the significant de-risking of the aggregate bank balance sheet that has occurred since 2008 in a longer-term context. While the declining loans-to-assets ratio continues a longer-term trend—albeit, at an accelerated pace—the surge in deposit funding after the financial crisis represents an abrupt and sustained reversal of the long-term trend decline.
Depository Institutions’ Deposits and Loans
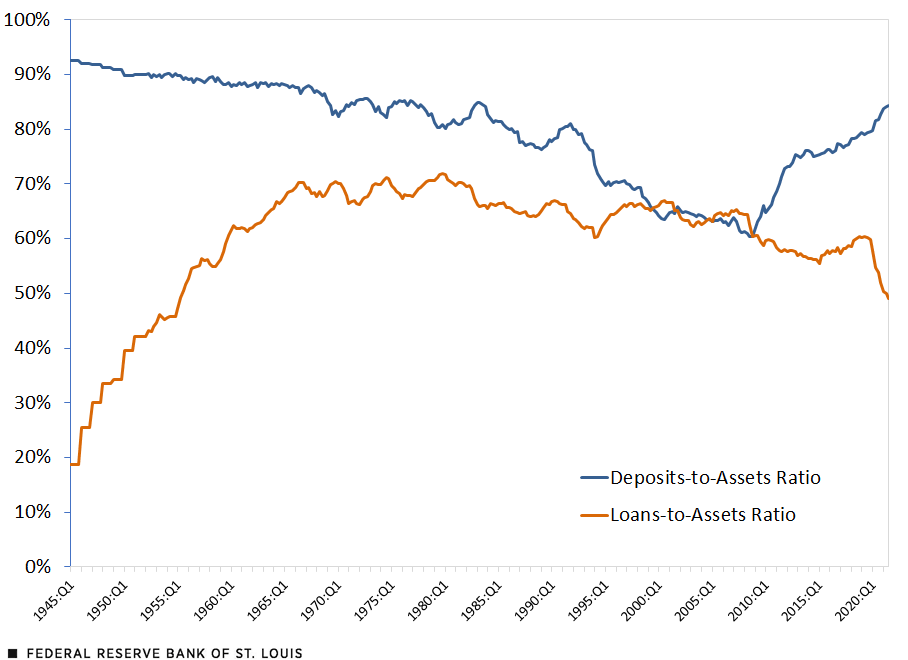
SOURCES: Federal Reserve Board Financial Accounts of the United States (FAOTUS) and author’s calculations.
DESCRIPTION: The figure shows the quarterly ratios of deposits and loans to total bank assets between the first quarter of 1945 and the third quarter of 2021. The deposits-to-assets ratio declined from 93% in 1945 to 60% in 2008—its lowest level in the figure. Thereafter, the ratio increased sharply to more than 84% at the end of the third quarter of 2021. The loans-to-assets ratio increased from 19% in 1945 to a high of 72% in 1979. The ratio declined gradually to 64% by 2008, then fell more rapidly to 49% by the end of the third quarter of 2021.
The loans-to-deposits ratio is a measure that combines the two sides of banks’ balance sheets. (See the table below.) A high loans-to-deposits ratio, as in the second quarter of 2008, points toward higher potential profitability because loans typically are the most profitable asset category. But it also signals higher risk—both credit risk from potential loan defaults, and liquidity risk from illiquid loans and relatively low deposit funding of assets.
| 2008:Q2 | 2021:Q3 | |
|---|---|---|
|
Deposits-to-Assets Ratio |
60.8% |
84.4% |
|
Loans-to-Assets Ratio |
64.4% |
49.1% |
|
Loans-to-Deposits Ratio |
106.9% |
58.2% |
SOURCES: Federal Reserve Board FAOTUS and author’s calculations.
A very low loans-to-deposits ratio, on the other hand, as in the third quarter of 2021, points toward lower potential profitability but also lower risk (both credit risk and liquidity risk). In fact, the 58.2% loans-to-deposits ratio in the third quarter of 2021 is the lowest since the fourth quarter of 1955.
Why Have Banks De-Risked Both Sides of Their Balance Sheets during Periods of Large-Scale Fed Asset Purchases?
As I pointed out in my first post, the Federal Reserve’s balance sheet has risen by $7.8 trillion since Sept. 10, 2008; during that same period, banks’ assets have increased by $10.2 trillion, while their liabilities rose $8.9 trillion. Despite the similar changes, the composition of banks’ assets and liabilities is not dictated directly by the Fed’s creation of reserves to support its asset purchases.
Why did banks de-risk both sides of their balance sheets especially when the Fed was engaging in large-scale asset purchases? As argued in my first post, a direct causal link (banks passively accepting higher reserve balances and deposit inflows with no offsetting adjustments) is implausible, because banks could have increased lending and altered their funding mix much more if they had wanted to maintain previous balance-sheet ratios. For example, banks could have raised additional equity capital and extended billions of dollars of new loans, rather than choosing to shift their balance sheets away from loans and toward deposits.
The Fed’s initial rationale for large-scale asset purchases focused on supporting the functioning of financial and housing markets both in 2009 and in 2020, as noted in the Federal Open Market Committee (FOMC) statements on Dec. 16, 2008, and Mar. 15, 2020. Only after financial turbulence had subsided in each episode did the policy objective of the Fed’s asset purchases shift decisively toward supporting the economy more broadly, as noted in the FOMC statements of Nov. 3, 2010, and Apr. 29, 2020.
These two posts have shown that changes in banks’ balance sheets worked in the opposite direction of the Fed’s asset purchases when their purpose became economic stimulus. I have argued that this reflects changing regulatory requirements (for example, more-demanding liquid assets-to-assets ratios) and an economic environment perceived by banks as warranting greater caution rather than a shift toward growth and greater risk.
Notes and References
- Large-scale Fed asset purchases do not dictate the size or composition of banks’ balance sheets, but they impose a significant constraint on bank assets. When the Fed purchases Treasury or agency securities from a dealer bank, it pays for the purchase by crediting the bank’s Federal Reserve deposit account in the amount of the purchase. The bank can then use those funds to buy other assets if it chooses to do so, which moves the reserve balances to other banks. But unless and until the Fed removes reserve balances from the banking system, by selling bonds to a dealer bank, those balances will remain on the consolidated balance sheet of the entire banking system. In other words, banks can and do adjust other asset categories in response to Fed reserve creation.
- “Asset liquidity” refers to the ease of selling items on a bank’s balance sheet without incurring a liquidity discount in the selling price. Securities and cash assets have greater asset liquidity than loans and other risky assets. “Funding liquidity” refers to the ease of raising, and the likelihood of retaining, funds to support bank assets. Core deposits have high funding liquidity because they are unlikely to be withdrawn in a period of market stress, nor do they require repricing. Large time deposits, nondeposit borrowings and equity financing have lower funding liquidity because these categories may be difficult to obtain in periods of stress, except at high cost, or may be subject to panic withdrawals or adverse repricing (especially short-term non-deposit borrowings or large uninsured deposits).
- These terms refer to “quantitative easing, phase 2” and “quantitative easing, phase 3,” respectively.