

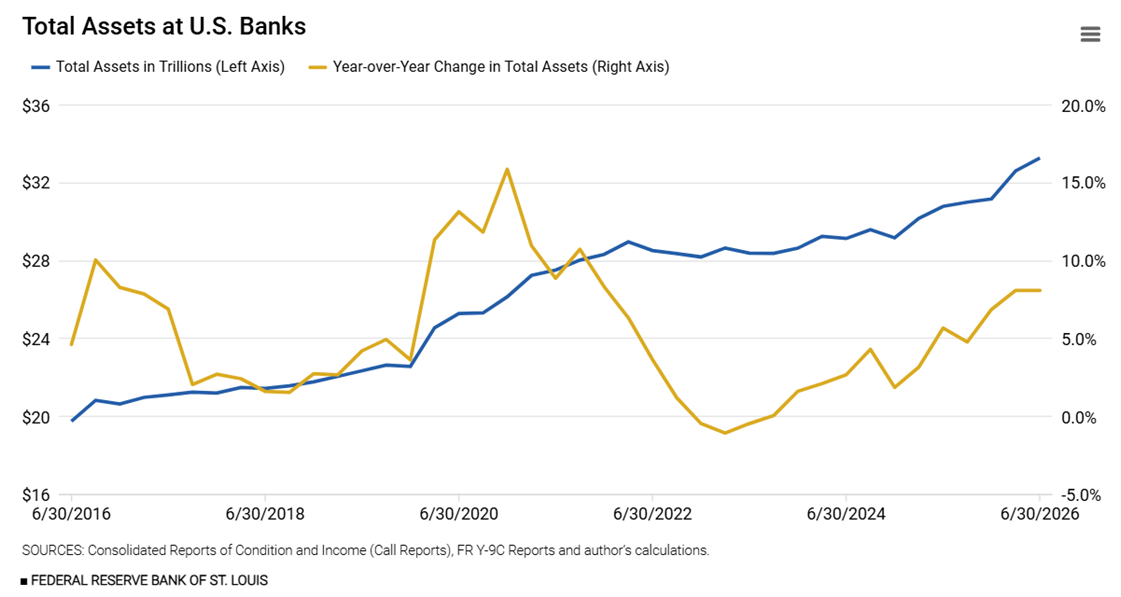
The U.S. banking industry maintained robust growth in the second quarter of 2026, with total assets at banks increasing 2% quarter-over-quarter and 8% year-over-year to $33.3 trillion.1 (See the first figure below.) Total loans, including those held for sale, comprised the largest share of the balance sheet in the quarter ending June 30, growing $291 billion from the previous quarter to $14.6 trillion. Trading assets and other assets2 showed steady expansion, while cash holdings declined modestly. Investment security portfolios remained relatively flat, reflecting just 0.4% growth during the quarter.
The following sections capture other key performance indicators, offering a snapshot of recent banking industry conditions.
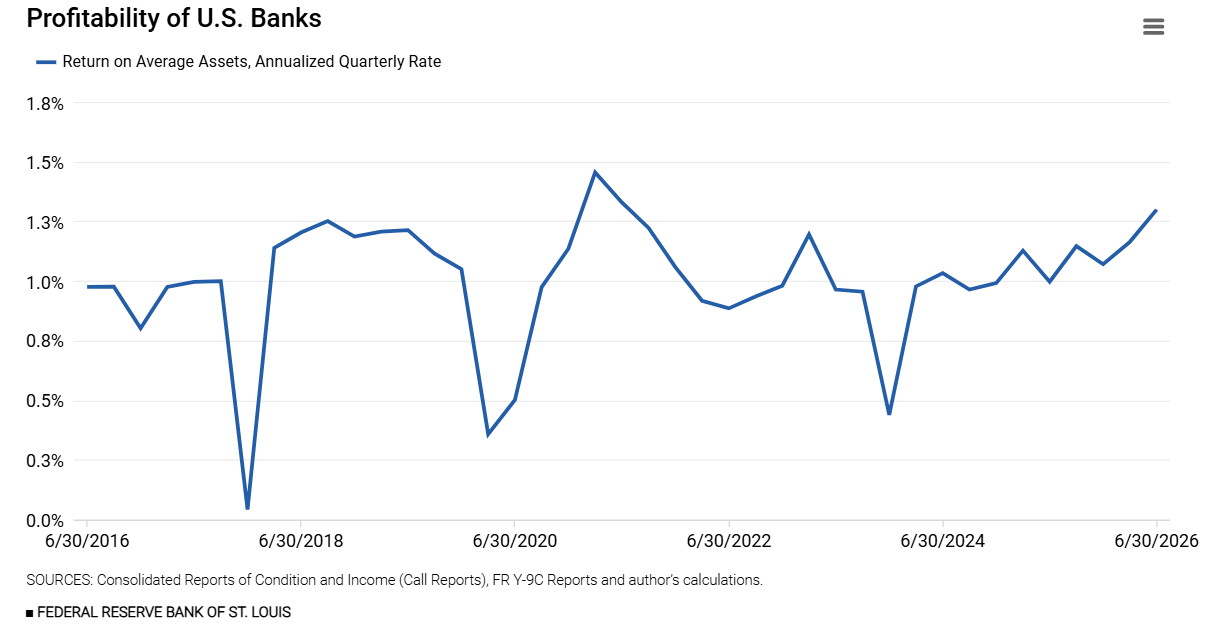
Profitability Reached Its Highest Level since 2021
U.S. banks posted an annualized quarterly return on average assets of 1.30% in the second quarter, up from 1.17% in the year’s first quarter. (See the next figure.) While improving net interest income — revenue generated from core banking operations — supported this gain, the average annualized quarterly net interest margin for banks remained relatively stable at 3.24% in the second quarter, compared with 3.22% in the prior quarter.3 Noninterest income, which also was at its highest level since 2021, has become a material contributor to banking profitability. Specifically, investment advisory and underwriting fees and trading revenue have been growing for several quarters.
Noninterest expenses, primarily driven by personnel costs and other expenses, were flat in the quarter, while provision expenses for loan-loss reserves remained modest.
Credit Quality Continued to Remain Stable
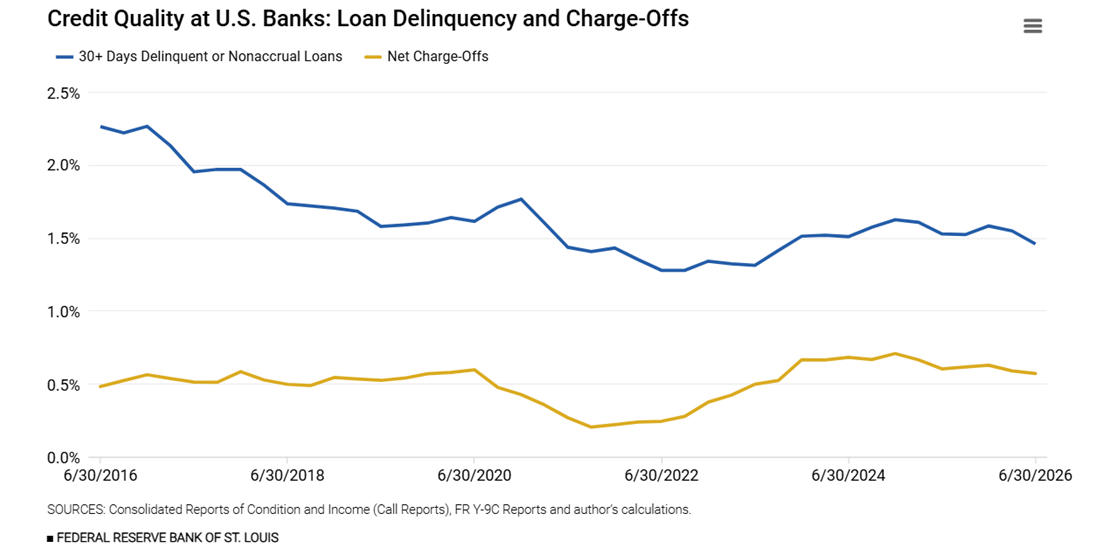
Nonaccrual loans and loans 30 days or more past due declined modestly in the second quarter to 1.46% of total loans, in line with recent levels.4 (See the following figure.) Loan performance was mixed, with delinquency rates declining across commercial real estate, commercial and industrial, residential real estate and agricultural loan portfolios. However, rates of noncurrent consumer loans remained elevated, with credit card and auto loan delinquencies totaling 2.85% and 3.71% of total loans, respectively. Net charge-offs improved to 0.57% of average loans from 0.59% in the first quarter, continuing the downward trend that began at year-end 2024. Net charge-offs represent the difference between gross charge-offs of bad loans and recoveries on delinquent debts. Lower charge-offs are, therefore, preferred to higher charge-offs.
Industry Liquidity Measures Were Also Steady
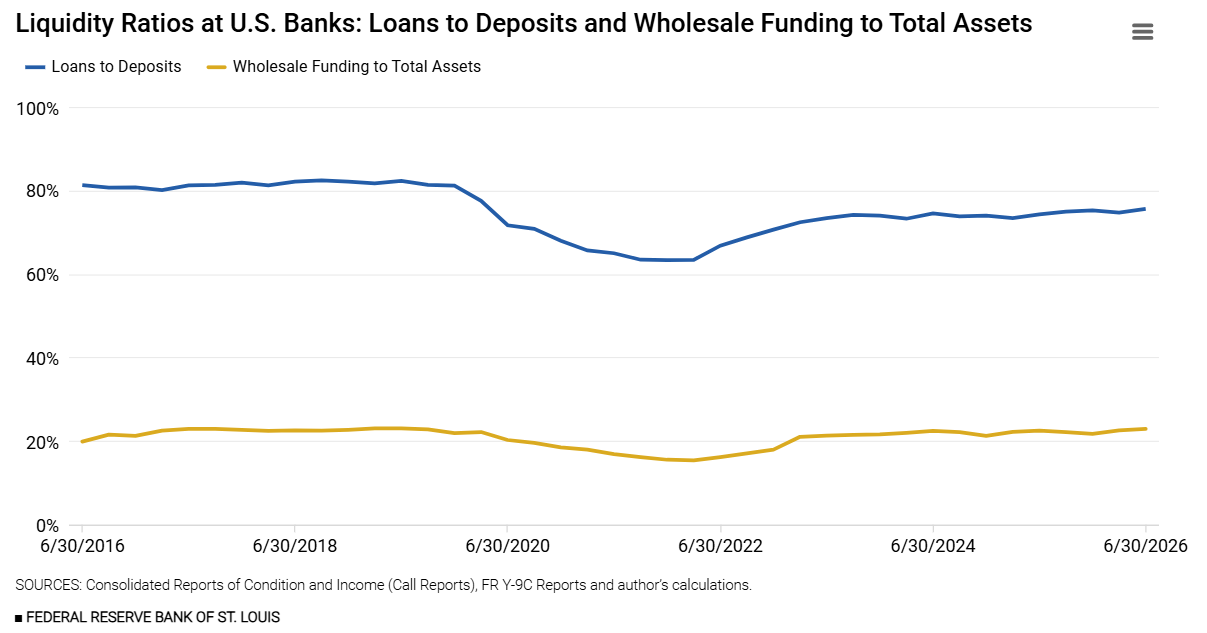
Turning to liquidity,5 the loan-to-deposit ratio increased to 75.6% in the second quarter from 74.7% in the previous quarter. The loan-to-deposit ratio measures the percentage of a bank’s total deposits extended as loans. A higher ratio suggests moderately higher balance sheet leverage, with the bank holding fewer liquid assets to cover sudden customer withdrawals or unexpected expenses. The banking industry’s loan-to-deposit ratio remains subdued compared with the period just prior to the COVID-19 pandemic.
Additionally, in the second quarter, banks’ funding mix shifted modestly toward wholesale funding sources. Banks use wholesale funding — including Federal Home Loan Banks borrowings, brokered deposits and federal funds purchased — alongside customer deposits to fund loans and manage liquidity. Wholesale funding rose to 23.0% of total assets from 22.6% in the prior quarter. (See the figure below.)
Bank Capital Levels Declined Modestly
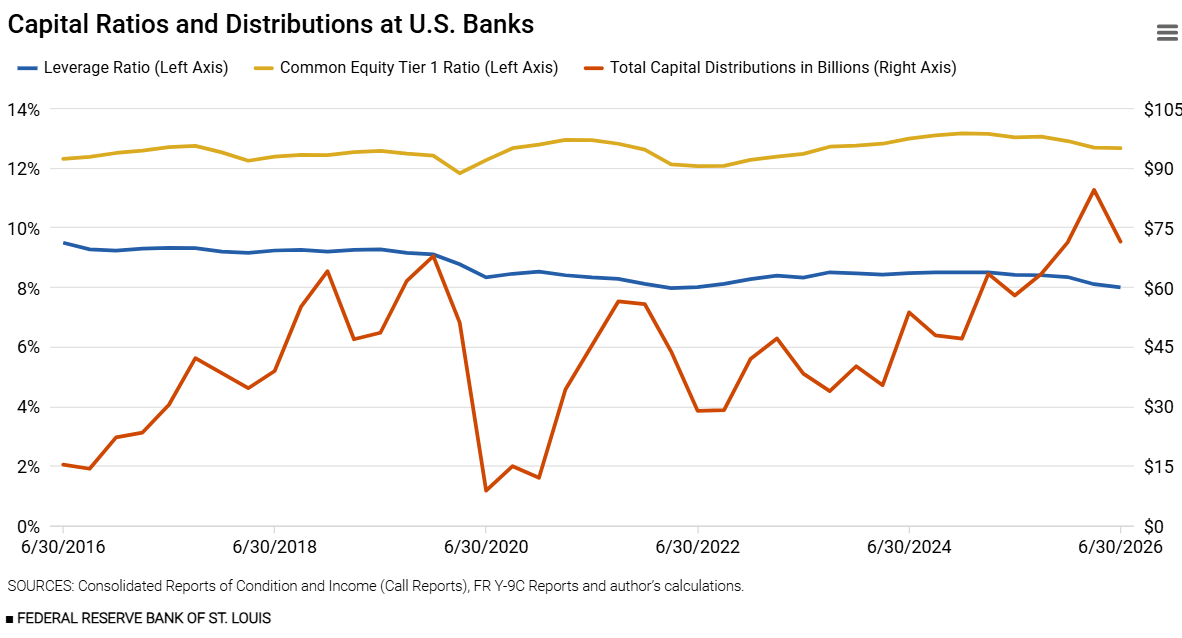
Bank capital ratios edged lower in the second quarter. The leverage capital ratio declined to 7.99% from 8.10%, while the Common Equity Tier 1 capital ratio fell slightly, to 12.66% from 12.68%.6 (See the last figure.) Capital distributions totaled $71.5 billion in the second quarter, down $13.0 billion from the first quarter.7 However, banks’ capital distributions have increased significantly over the past three years, contributing to some modest erosion in capital ratios despite strong profitability.
Notes
- The U.S. banking industry, as defined here, reflects the consolidated financial statements for commercial banks, their holding companies and foreign banking organizations that file the Call Report or the FR Y-9C Report. All data are reported as the industry aggregate unless otherwise stated.
- Other assets include prepaid expenses, accounts receivable, deferred tax assets, equity investments not held for trading, life insurance assets, repossessed assets, goodwill and other intangible assets, and other miscellaneous assets.
- The net interest margin is calculated using bank-only data, because this performance metric is meaningful only at the operating bank level, where deposit-taking and lending activities occur.
- Nonaccrual loans are loans for which the accrual of interest has been discontinued because full collection of principal and interest is no longer considered probable, typically due to delinquency status or borrower financial difficulties.
- Liquidity is the risk to a bank’s earnings and capital arising from its inability to timely meet obligations when they come due without incurring unacceptable losses.
- The leverage ratio has a specific meaning in terms of capital requirements: It is the ratio of Tier 1 capital (with certain adjustments) to consolidated assets. Tier 1 capital is high-quality, loss-absorbing forms of capital, such as common equity. Unlike other regulatory capital ratios, assets are not risk-weighted for purposes of the leverage ratio. Meanwhile, the Common Equity Tier 1 (CET1) capital ratio represents the core equity of a bank. This ratio consists of retained earnings and common stock. CET1 is the highest-quality bank capital and serves to absorb initial losses, because a bank faces no obligation to repay it and can write down its value in the event of losses. In this ratio, assets in the denominator are risk-weighted.
- Capital distributions are defined here as dividends paid and net share repurchases, both of which reduce capital by decreasing retained earnings and shares outstanding.